
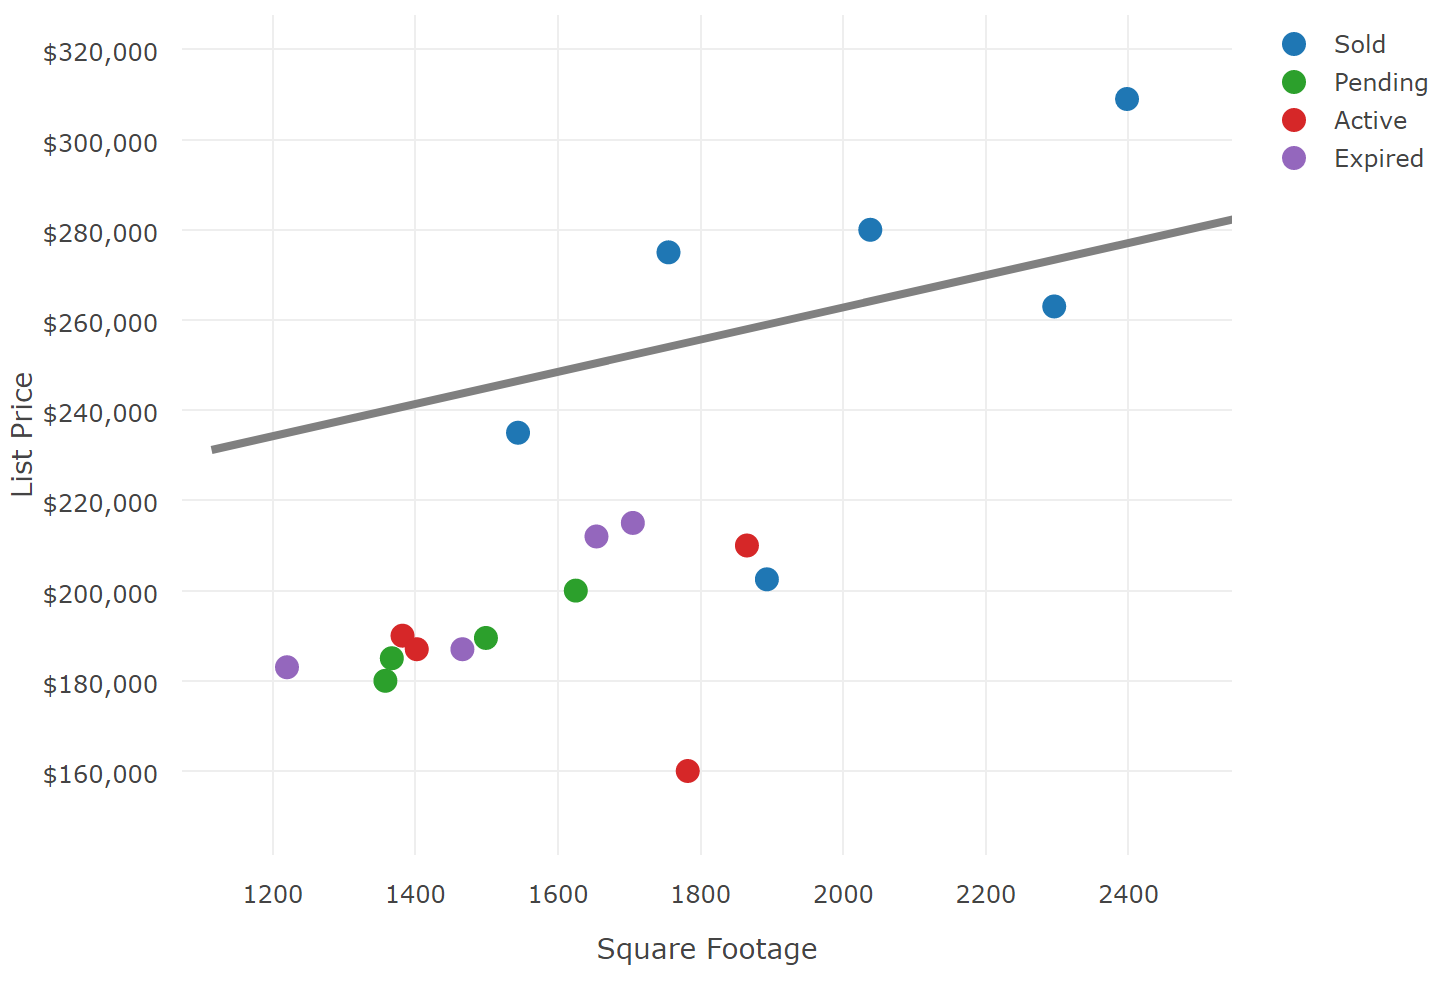
When using Listing Charts you have the opportunity to use many more properties as comparables than you might be used to. Let’s walk through an example of the chart-making process with a realtor who had listed a client’s home, 2750 Estates Lane (3,070 square feet - 4 bed - 3.5 baths - listed at $589,000), but the price was too high and the realtor was trying help her clients understand that.
Chart #1 - Direct comps
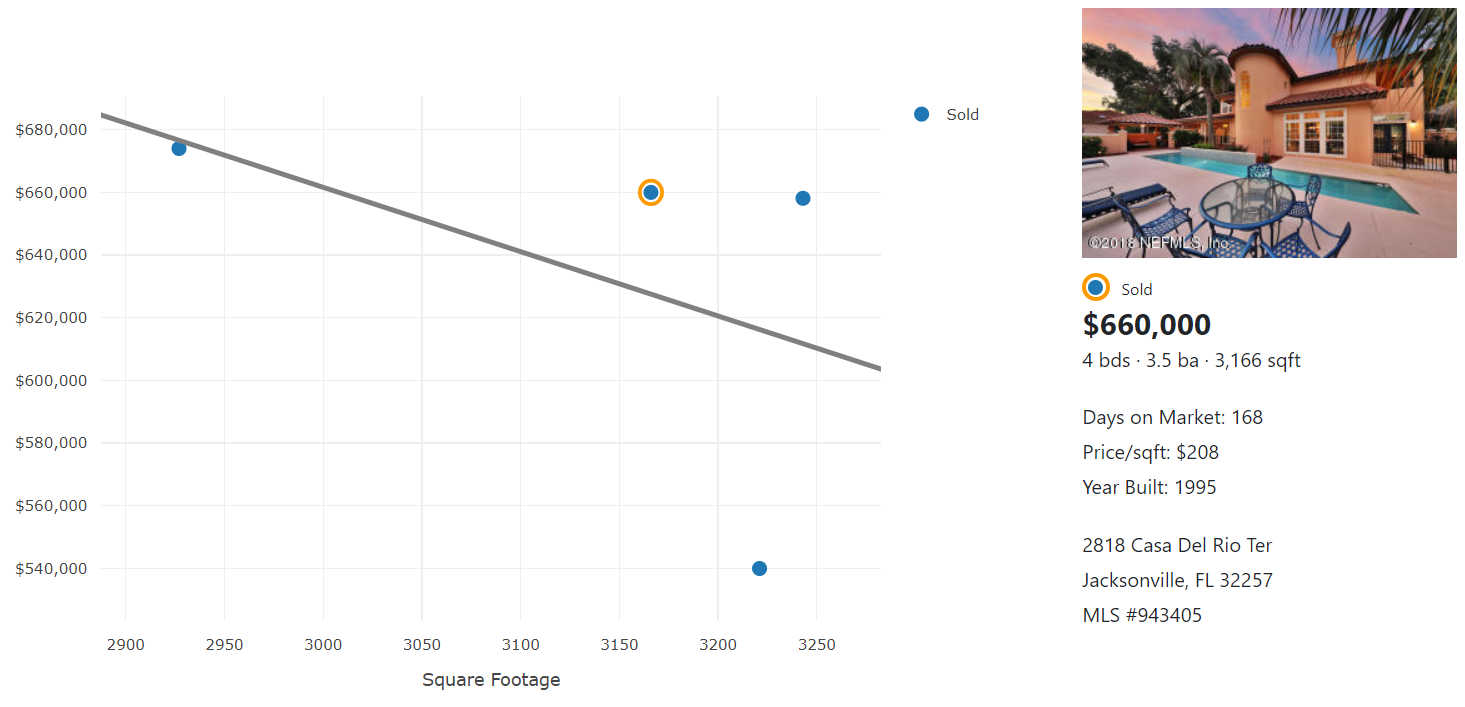
The first idea was to use the best direct comps. that chart is shown here. These are 4 best comps, but our Market trend line (the gray line) is going in the wrong direction, and a 3,070 sq.ft. home listed at $589,000 looks like it should be competitively priced. However, this chart doesn’t give the client much perspective on what’s going on in their neighborhood housing market. Let’s see if we can get a little more data in.
Chart #2 - A little more data helps
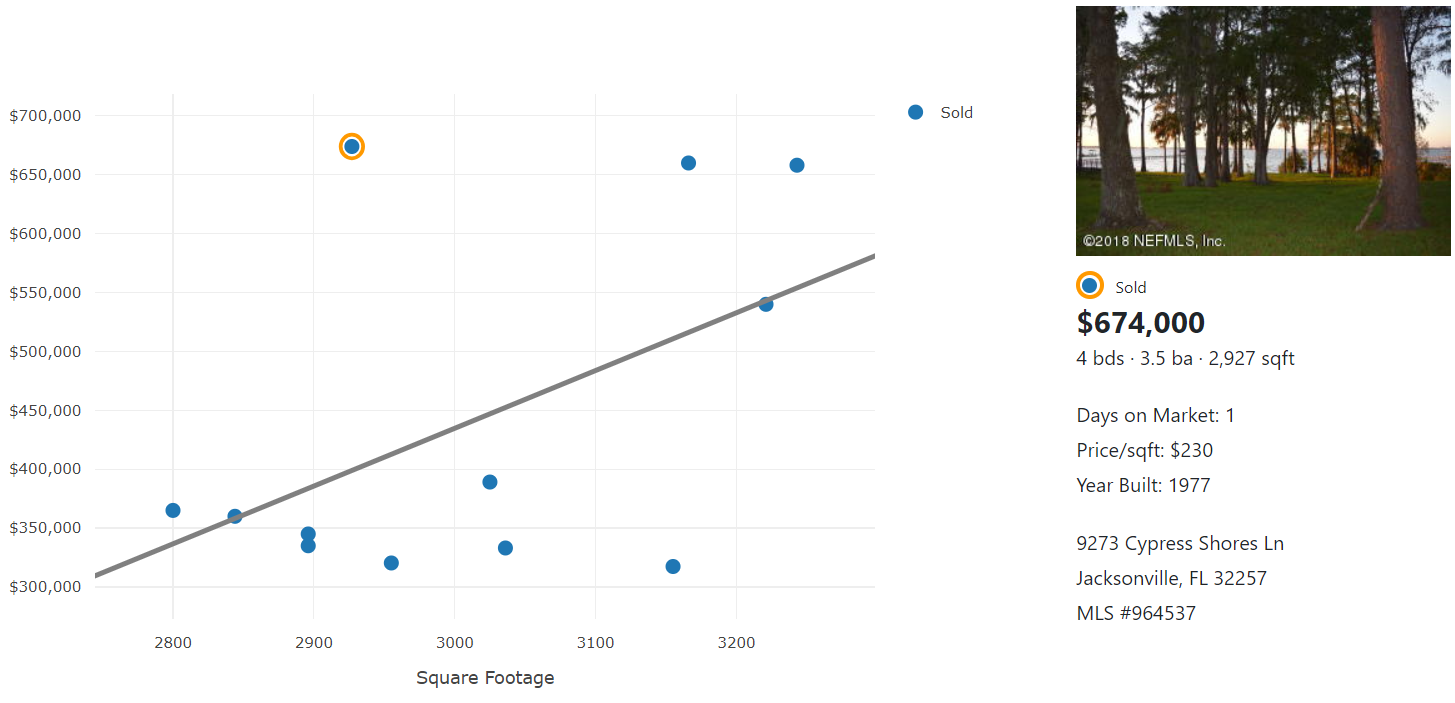
Okay, adding a few more sold properties of varying square footages are starting to give us a chart that really reflects what is going on in the market for this neighborhood. We have a much more accurate market trend line (the gray line), and the client’s home does appear to be overpriced when compared a broader view of other properties. But let’s take this chart one more step to really drive the point home.
Chart #3 - Letting the chart tell the story
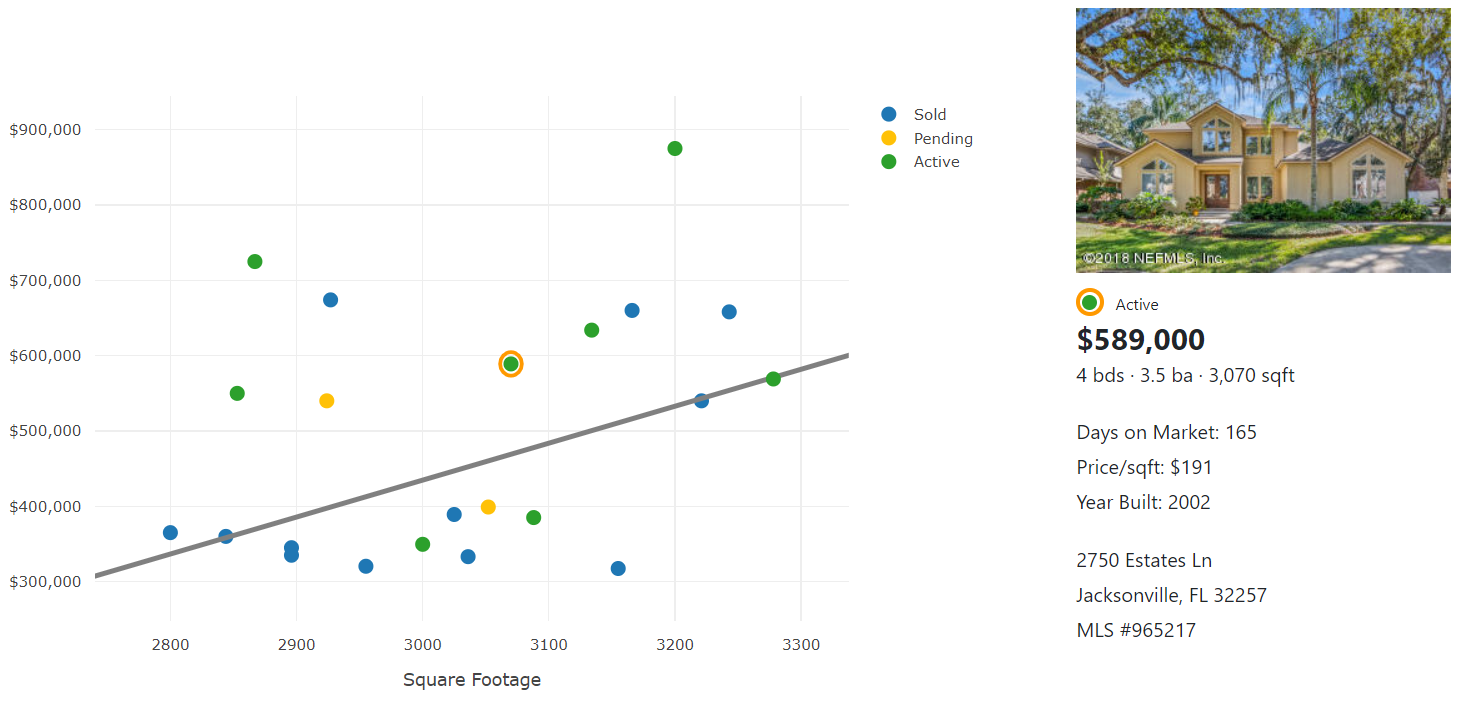
That’s what I’m talking about! We have added pending and active properties to our data export (including the client’s current listing, which is highlighted). The listing is above the market trend line, and all the activity is happening below that line. Next question for the client: How are we going to make your property stand out and sell faster?
Takeaway:
Often times the more data the better. Remember we are trying to help our clients visualize the home values in their neighborhood, not just compare their house to direct comps (even though this is still a powerful step). To use Listing Charts to its fullest, you will likely need to think of using comps differently than you may have done in the past. Let the chart tell the story!
What do you think? Comment below.